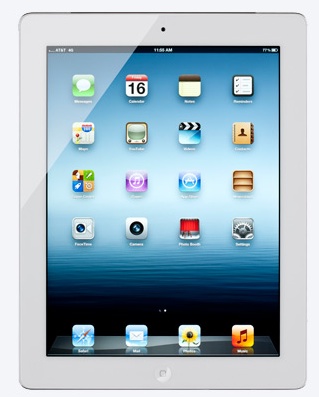
iPad users shop different
Forget Think Different. iPad users Shop Different, according to new data by RichRelevance, a provider of dynamic personalization for the world’s largest retailers and brands.
The company's report, "The 2012 Q1 Shopping Insights Mobile Study" (http://www.richrelevance.com/insights/mobile-shopping/), finds a steady rise in mobile share of revenue from 1.9% in April 2011 to 4.6% in March 2012, with the iPad driving nearly all shopping, browsing and purchasing in this emerging channel.
According to the study:
° iPad users spent significantly more time and money on retail sites than other mobile users.
° iPad users constitute the bulk of all mobile shoppers -- accounting for about two-thirds (68%) of shoppers.
° The iPad accounts for 90% of all mobile revenue (and 4% of total retail revenue).
° Conversion rates were also strongest with the iPad (1.5% for iPad vs. 0.57% for other mobile devices).
° Average pages per session were highest for the iPad compared with all other mobile devices, at nearly six pages per session (5.7 for iPads vs. 3.6 for iPhone vs. 4.1 for other mobile devices).
What's more, iPad users spend dramatically more -- on fewer items -- than other mobile shoppers. When compared to online shoppers, iPad users spend approximately the same amount on an average order, but buy much more expensive products.
The iPad had the highest average order value (AOV) of any mobile device: US$158 for iPad vs. $105 for other mobile devices vs. $104 for iPhone and other iOS devices in March 2012. Interestingly, AOV for iPad shopping is creeping ahead of the AOV from desktop computers. ($158 for iPad vs. $153 from desktops).
While they spend more per average order, iPad shoppers had on average fewer number of items per order of any mobile device (2.98 for iPad vs. 4.22 for other iOS devices vs. 4.41 for all other mobile devices in March 2012) Overall, iPad shoppers averaged $52.66 per item vs. $21.86 per item for desktop users and $23.80 for other mobile users.


